2022 Catch return – trout
Our resident professor, Jon Grey, has been crunching the numbers on the 2022 catch return. Here is his analysis of what appears to have been a good year, despite the problematic weather……….
Thanks to those members who have been filling in the online catch return forms and including those (unfortunate) blanks – they are every bit as important to report when it comes to trying to standardise for effort! We’re starting to build a picture of how the rivers are performing and how often the beats are being fished. Of course there are lots of caveats which we have covered briefly in a previous blog, here.
So, at the end of the 2022 trout season, the headlines are that around 450 trout were reported, and on average, people caught 1.8 trout per session.
The Aire remains a firm favourite, accounting for ~2/3 of the trout, and most specimen fish, but good sport was had on the Ure and the Wharfe beats
Almost 50% of fishing effort was compressed into May & June – seems our members are fair weather anglers…. Perhaps unsurprisingly or maybe thankfully, fishing effort tailed off in July & August during the peak temps and low flows, and remained low til the end of the season.
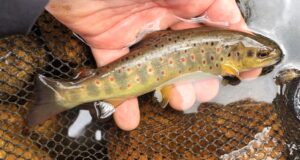
It’s good to see smaller (<8”) trout being caught, and the overall pattern is of a reasonably balanced trout population, certainly for the Aire. Below, I have tabulated the data per beat for the size-bins.
| Aire | <8″ | 8″-10″ | 10″-15″ | 15″-18″ | >18″ | Total trout | Reports | Trout / visit |
| Carleton | 9 | 5 | 5 | 1 | 5 | 25 | 19 | 1.3 |
| Cononley | 4 | 4 | 4 | 1 | 1 | 14 | 14 | 1.0 |
| Funkirk | 12 | 26 | 7 | 4 | 1 | 50 | 32 | 1.6 |
| Gargrave | 65 | 43 | 29 | 10 | 8 | 155 | 86 | 1.8 |
| Kildwick | 14 | 2 | 4 | 0 | 0 | 20 | 8 | 2.5 |
| Steeton | 9 | 3 | 0 | 0 | 0 | 12 | 4 | 3.0 |
| 113 | 83 | 49 | 16 | 15 | 276 | 163 | 1.7 | |
| Ribble | <8″ | 8″-10″ | 10″-15″ | 15″-18″ | >18″ | Total trout | Reports | Trout / visit |
| Skirbeck | 17 | 11 | 10 | 6 | 3 | 47 | 21 | 2.2 |
| Wharfe | <8″ | 8″-10″ | 10″-15″ | 15″-18″ | >18″ | Total trout | Reports | Trout / visit |
| Appletreewick | 1 | 0 | 1 | 0 | 0 | 2 | 2 | 1.0 |
| Arthington | 5 | 9 | 7 | 1 | 0 | 22 | 21 | 1.0 |
| Buckden | 10 | 13 | 14 | 1 | 0 | 38 | 14 | 2.7 |
| Burley | 1 | 0 | 1 | 2 | 0 | 4 | 2 | 2.0 |
| Hubberholme | 2 | 4 | 1 | 0 | 0 | 7 | 5 | 1.4 |
| 19 | 26 | 24 | 4 | 0 | 73 | 44 | 1.7 | |
| Ure | <8″ | 8″-10″ | 10″-15″ | 15″-18″ | >18″ | Total trout | Reports | Trout / visit |
| Aysgarth | 8 | 5 | 9 | 0 | 0 | 22 | 8 | 2.8 |
| Worton | 4 | 5 | 13 | 2 | 0 | 24 | 14 | 1.7 |
| 12 | 10 | 22 | 2 | 0 | 46 | 22 | 2.1 |
From the data, it has been possible to estimate basic metrics like trout per visit. Our underfished waters returned some of the most favourable statistics! There’s a lesson there somewhere….
As an example of variability throughout the year, I have tabulated the Aire data per month, below
| Aire | March | April | May | June | July | August | Sept |
| Trout | 5 | 6 | 127 | 65 | 31 | 23 | 19 |
| Reports | 7 | 21 | 46 | 37 | 17 | 14 | 12 |
| Trout / visit | 0.7 | 0.3 | 2.8 | 1.8 | 1.8 | 1.6 | 1.6 |
From these, you can see that ~70% of Aire fish were caught in May & June but May was the month to be fishing in terms of ‘success’ rate at 2.8 fish per session. Contrast that to hard yards in April this year with abnormal hatches during the exceptionally dry spring.
So, despite another ‘odd’ year (the new normal), and not everyone reporting their catches still, folk have been finding the fish and having some good sessions.
I’ll update for some of the other species in due course. Tight lines for the grayling, or pike if you like your ladies of the stream with a little more bite…